
Page 41 - 2023-24 Learning Report Aug 2025
P. 41
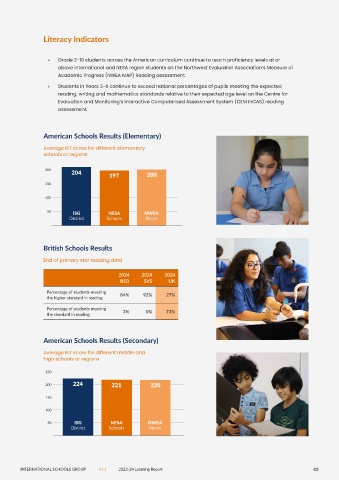
Literacy Indicators


                     »  Grade 2-10 students across the American curriculum continue to reach proficiency levels at or
                     above international and NESA region students on the Northwest Evaluation Association’s Measure of
                     Academic Progress (NWEA MAP) Reading assessment.
                     »  Students in Years 3-6 continue to exceed national percentages of pupils meeting the expected
                     reading, writing and mathematics standards relative to their expected age level on the Centre for
                     Evaluation and Monitoring’s Interactive Computerised Assessment System (CEM InCAS) reading
                     assessment.


                American Schools Results (Elementary)

                Average RIT score for different elementary
                schools or regions

                 200
                          204          197           200
                 150

                 100

                  50       ISG         NESA         NWEA
                         District     Schools       Norm


                British Schools Results


                End of primary star reading data

                                           2024    2024    2024
                                           BSD      SVS     UK
                 Percentage of students meeting   84%  92%  27%
                 the higher standard in reading
                 Percentage of students meeting   3%  0%   73%
                 the standard in reading


                American Schools Results (Secondary)

                Average RIT score for different middle and
                high schools or regions

                 250

                 200       224          221           220
                 150

                 100

                  50       ISG          NESA         NWEA
                          District     Schools        Norm


                                      › › ›
        INTERNATIONAL SCHOOLS GROUP                                2023-24 Learning Report                     40